 ar
ar bg
bg hr
hr cs
cs da
da nl
nl fi
fi fr
fr de
de el
el hi
hi it
it ko
ko no
no pl
pl pt
pt ro
ro ru
ru es
es sv
sv tl
tl iw
iw id
id lv
lv lt
lt sr
sr sk
sk sl
sl uk
uk vi
vi et
et hu
hu th
th tr
tr fa
fa ms
ms hy
hy ka
ka ur
ur bn
bn mn
mn ta
ta kk
kk uz
uz ku
ku
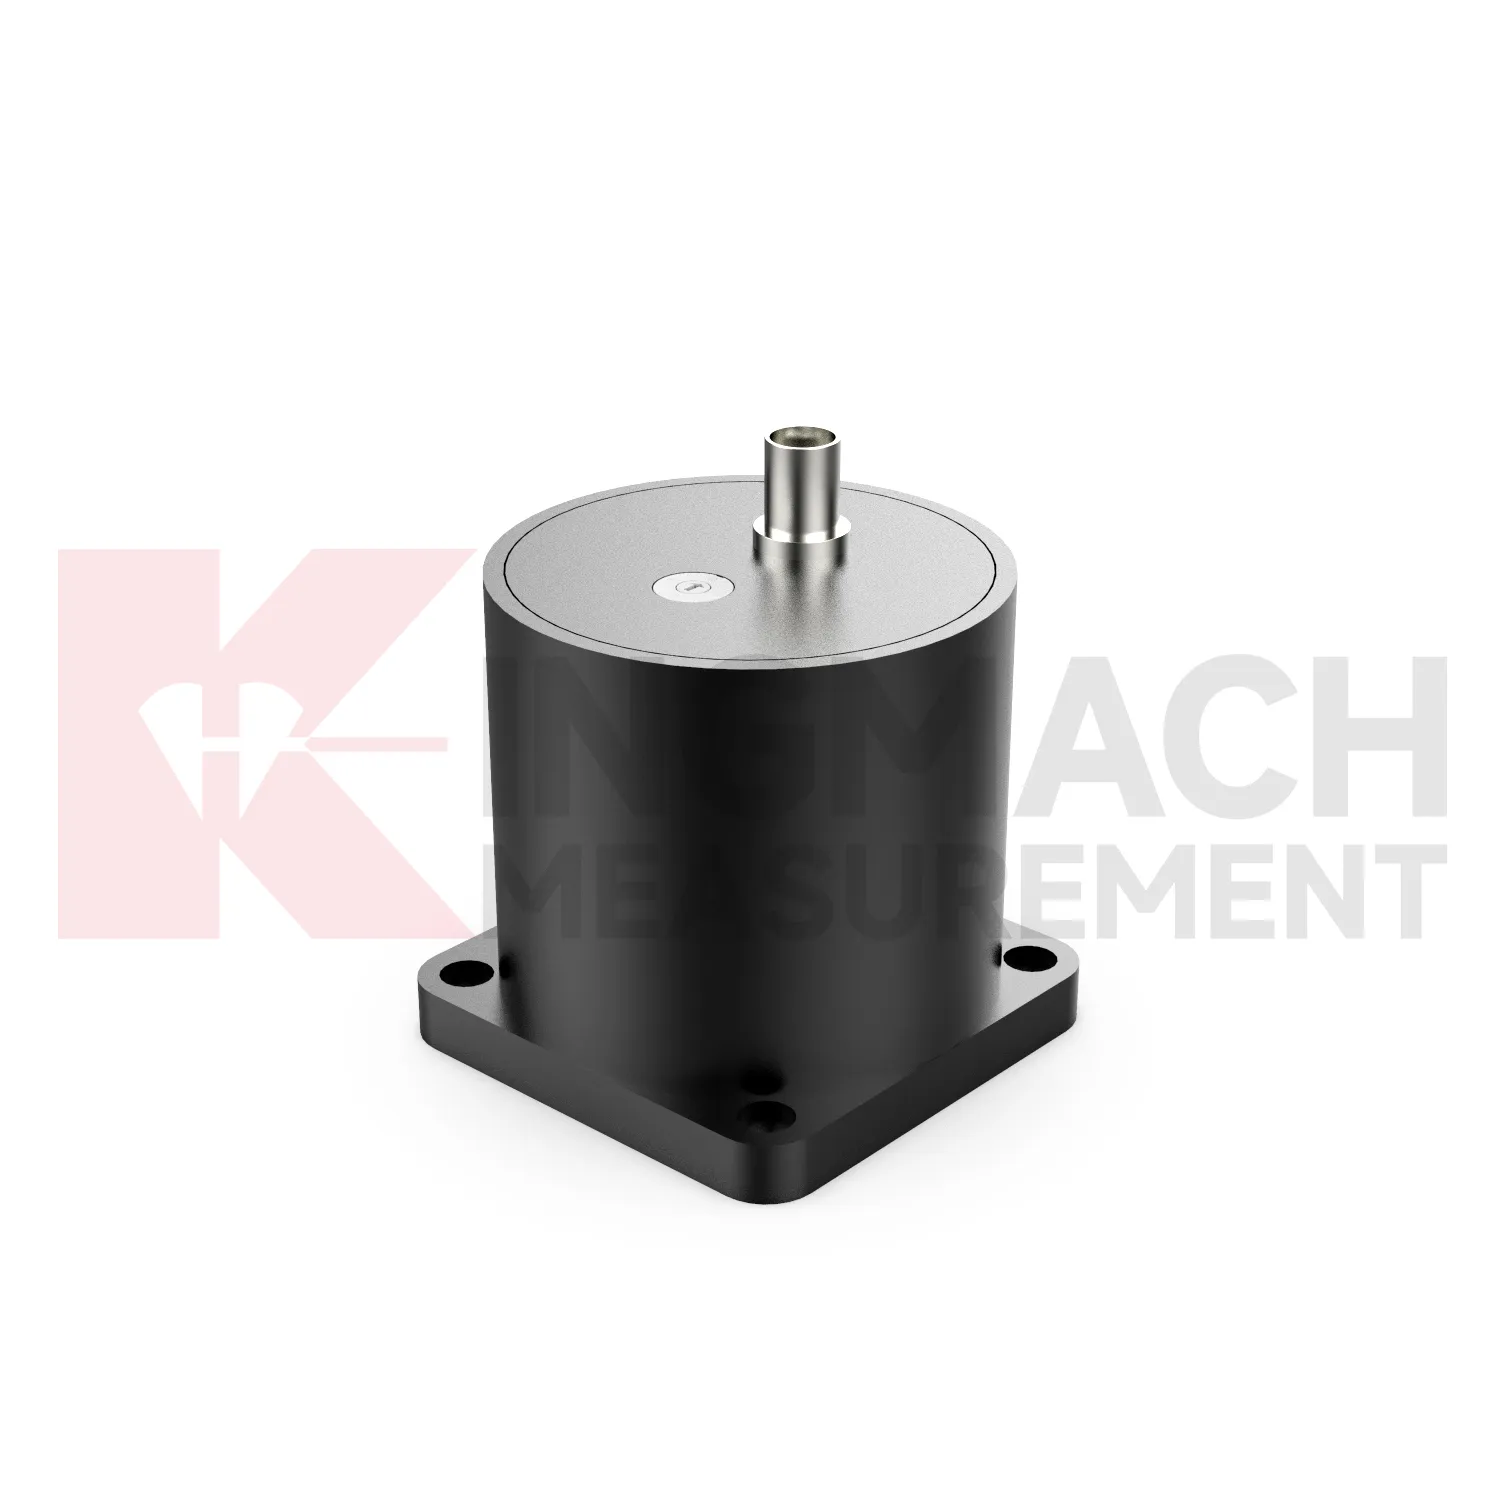
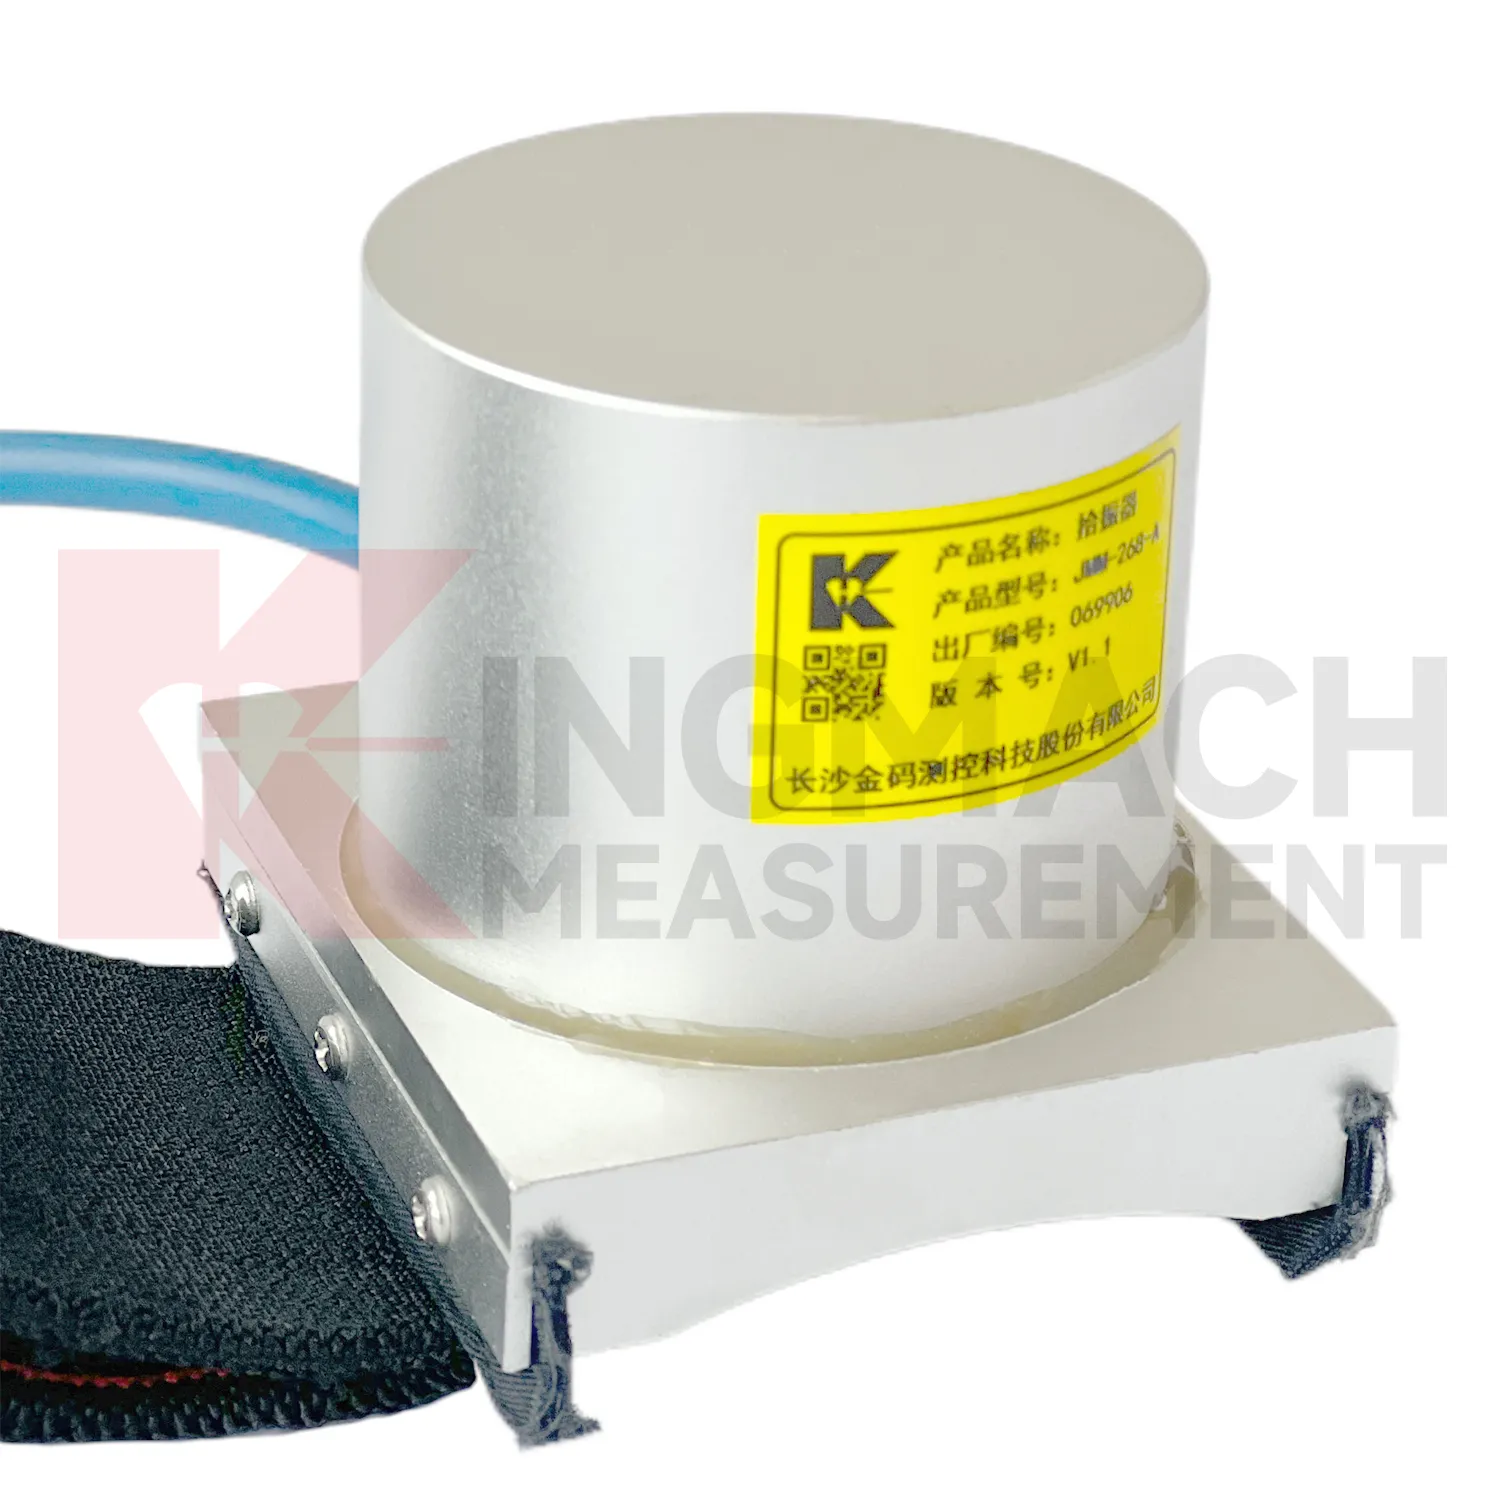
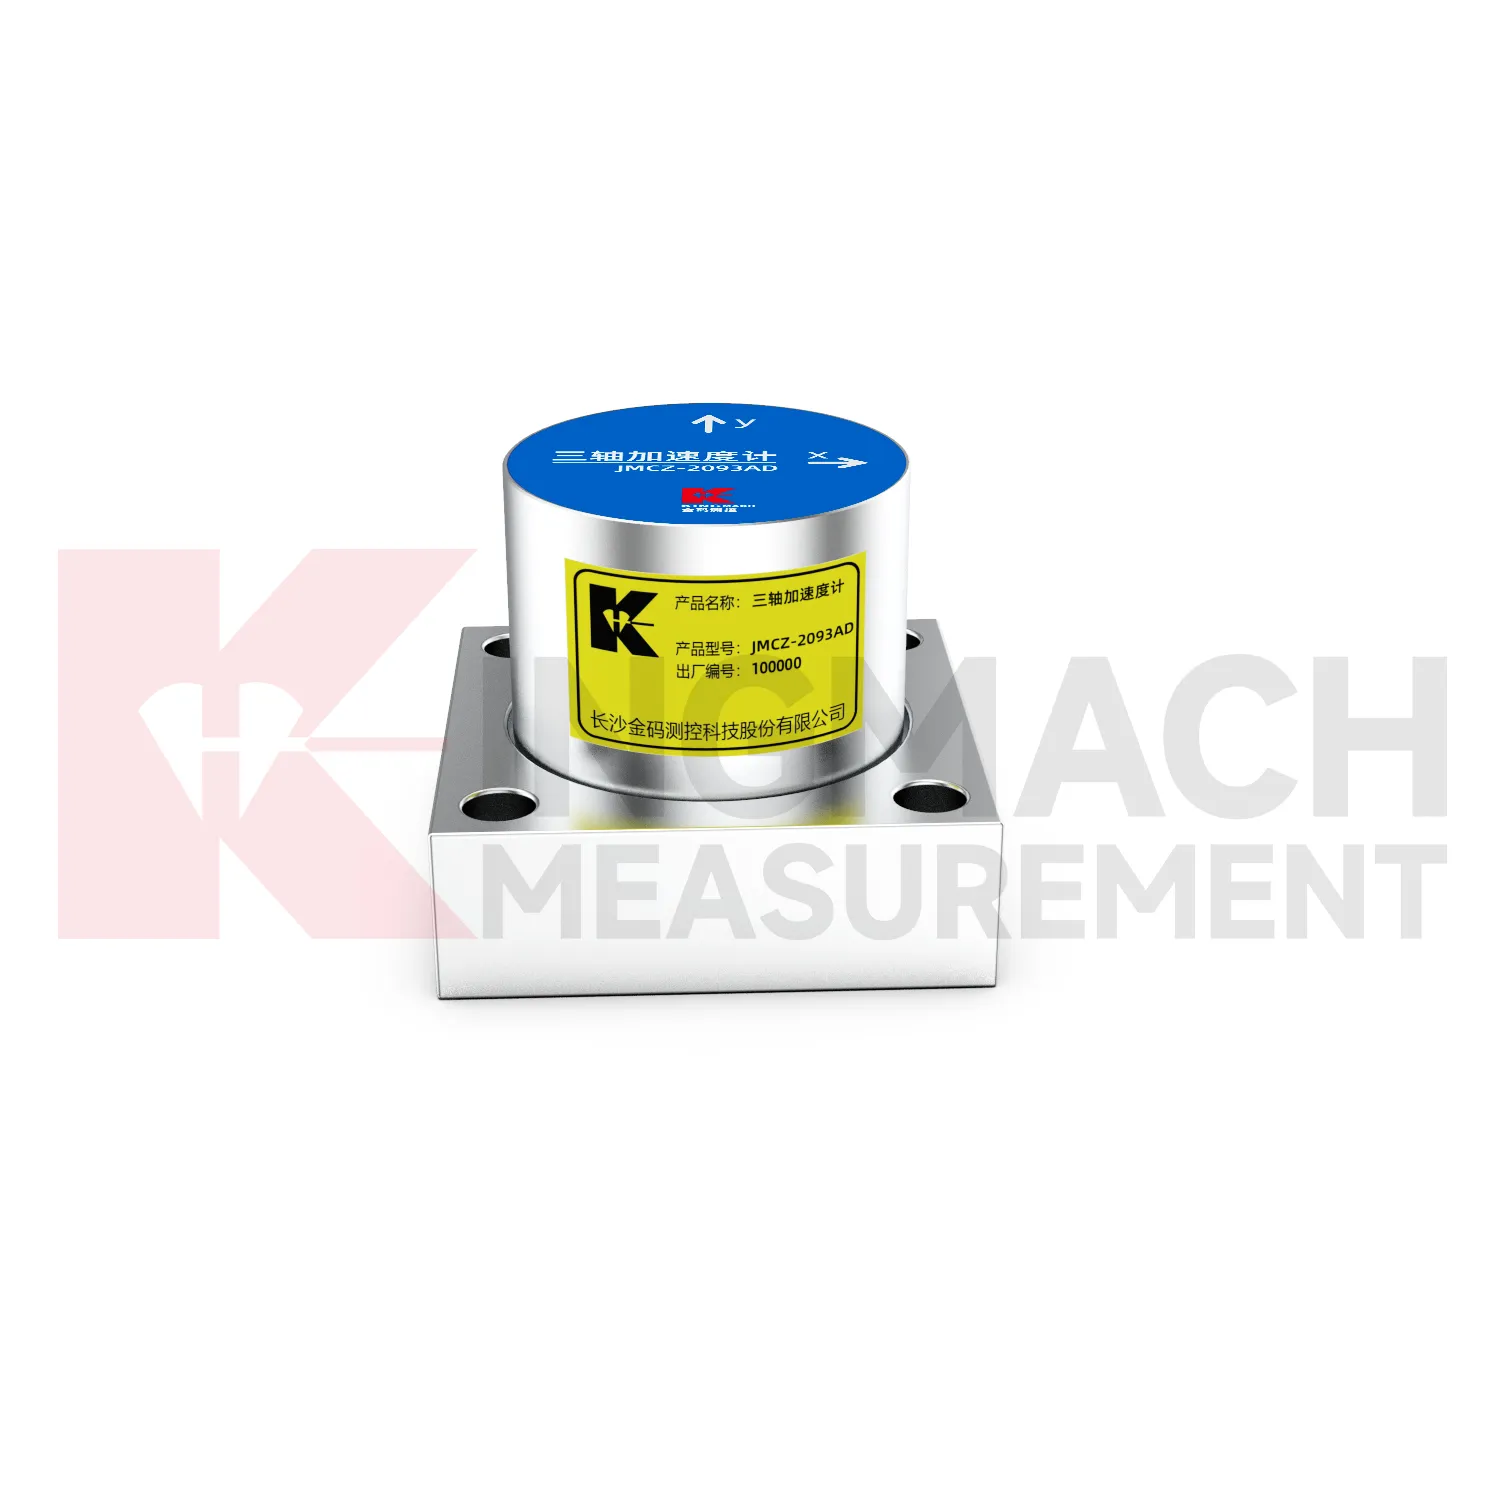
accelerometer vibration measurement
Kingmach accelerometer vibration measurement are suited to projects where dynamic response must be captured reliably rather than guessed from observation. Bridge cable systems, building floors, industrial structures, railways, tunnels, machinery foundations, and ground-motion stations all produce signals that need context. Some signals are strong and event-driven; others are weak and slow. Some need one direction; others need three. A careful product explanation should guide readers toward these distinctions without turning the text into a list of models. The right message is about measurement purpose, not product stacking. In the field, that same purpose should guide where the sensor is mounted, how the acquisition is configured, and how the result is reviewed after each important event.
For high-risk assets, inspection timing should follow events as well as calendar dates. After impact, blasting, severe weather, unusual vibration, or equipment maintenance, the sensor and the data path both deserve a quick check.
For field teams, the record is strongest when the waveform is tied to a named event and a known physical point. The note should state what was operating, what changed on site, whether other instruments reacted, and whether the motion repeated under similar conditions.
A useful dynamic record needs both signal quality and site context. Mounting condition, axis direction, cable stability, acquisition timing, and event labeling all affect whether the data can support an engineering decision after review.
Application of accelerometer vibration measurement
Cable force testing uses Kingmach accelerometer vibration measurement when vibration response is part of the force calculation method. The sensor must capture the cable motion cleanly, and the analysis must use the correct cable identity, boundary condition, and review process. A simple vibration trace is not enough by itself. The test record should preserve cable name, measurement position, weather, traffic or work condition, and calculation result. Written clearly, this application shows how dynamic measurement supports bridge maintenance without turning the page into formulas or specification tables. Repeatability is especially important. If future measurements use the same procedure, the owner can compare trends with more confidence.
The report should not leave the waveform isolated. It should explain what the asset was doing, why the point was measured, which event triggered interest, and what follow-up action or observation was made.
Dynamic data can be sensitive to small field changes. A new bracket, nearby machine, temporary work platform, changed cable route, or software update can alter the record, so those changes belong in the maintenance history.
For owner handover, the file should include point photos, axis labels, acquisition settings, related structural channels, and examples of normal behavior. That helps future reviewers understand whether a later event is unusual.
Weak-vibration review should include nearby walking, wind, traffic, equipment start-up, and construction activity because these sources can influence the trace. People walking nearby, wind, traffic, equipment start-up, and construction work can all influence the trace, so the field note should capture what was happening around the point.
The future of accelerometer vibration measurement
The future of Kingmach accelerometer vibration measurement will include stronger quality checks on dynamic data. Flatlines, clipping, loose mounting, channel swaps, cable noise, and wrong axis labels can all weaken a record. Automated review can flag suspicious patterns before engineers spend time interpreting bad data. This is especially useful in large monitoring networks with many points. Quality checks do not replace field inspection, but they help decide where inspection is needed. Clean data is the foundation of useful dynamic analysis. A reliable warning system must know the difference between real motion and a measurement path that has gone wrong.
Future quality tools should look at behavior patterns, not only missing data. A trace that repeats the same shape at the wrong time, loses high-frequency detail, or disagrees with nearby points may reveal mounting or acquisition trouble before a complete failure occurs.
These checks will make large dynamic networks easier to operate. Engineers can focus on events that deserve interpretation, while maintenance teams receive clearer signals about which point, cable, setting, or field condition needs attention.
Care & Maintenance of accelerometer vibration measurement
Axis control keeps Kingmach accelerometer vibration measurement records understandable. A sensor may be installed vertically, longitudinally, laterally, or in three directions depending on the monitoring task. If the axis direction is not written down, later reviewers may not know what the waveform represents. Mark the direction on drawings, photographs, and channel names. If a sensor is removed and reinstalled, confirm the direction again. Axis mistakes can create years of confusing data, especially on bridges, towers, tunnels, and machinery foundations. A simple label at installation can prevent serious interpretation problems later.
Dynamic data can be sensitive to small field changes. A new bracket, nearby machine, temporary work platform, changed cable route, or software update can alter the record, so those changes belong in the maintenance history.
For owner handover, the file should include point photos, axis labels, acquisition settings, related structural channels, and examples of normal behavior. That helps future reviewers understand whether a later event is unusual.
Kingmach accelerometer vibration measurement
Kingmach accelerometer vibration measurement support structural health monitoring by turning motion into a reviewable data trail. For bridge and building work, the data may help identify dominant frequency, cable behavior, vibration level, and response after an impact or construction event. For ground and earthquake studies, the record may show pulse timing and motion intensity. For machinery and industrial structures, repeated patterns can point to operating conditions or resonance. The monitoring plan should define what counts as normal, what requires field inspection, and which related sensors should be checked before making a decision. This prevents the vibration record from becoming an isolated curve and makes it part of a structured review process.
For owner handover, the file should include point photos, axis labels, acquisition settings, related structural channels, and examples of normal behavior. That helps future reviewers understand whether a later event is unusual.
Weak-vibration review should include nearby walking, wind, traffic, equipment start-up, and construction activity because these sources can influence the trace. People walking nearby, wind, traffic, equipment start-up, and construction work can all influence the trace, so the field note should capture what was happening around the point.
FAQ
Q: What maintenance do Kingmach accelerometer vibration measurement need?
A: Check mounting, cable condition, connector sealing, axis label, acquisition status, cabinet condition, and recent site disturbance.
Q: How often should they be inspected?
A: Frequency depends on asset risk, access, vibration level, and whether construction or severe weather is active nearby.
Q: What should be checked after a strong event?
A: Inspect sensor attachment, cable route, cabinet, data completeness, event labels, and related structural readings.
Q: Can software changes affect data?
A: Yes. Platform or acquisition changes can affect channel names, timing, storage, triggers, and analysis settings.
Q: How should replacement be documented?
A: Record old and new equipment, location, reason, date, technician, first test record, and any change to axis or channel name.
Dynamic data can be sensitive to small field changes. A new bracket, nearby machine, temporary work platform, changed cable route, or software update can alter the record, so those changes belong in the maintenance history.
Reviews
James Thompson
The tiltmeters and accelerometers are very sensitive and provide precise data. Perfect for our structural health monitoring system.
David Wilson
We purchased displacement transducers and settlement sensors, and the quality exceeded our expectations. Easy installation and reliable performance.
Latest Inquiries
To protect the privacy of our buyers, only public service email domains like Gmail, Yahoo, and MSN will be displayed. Additionally, only a limited portion of the inquiry content will be shown.
Isabella***@gmail.comGermany
Hello, we are evaluating weir flow meters for a water management project. Please share accuracy deta...
Ava***@gmail.comAustralia
Hi, I am looking for reliable tiltmeters and accelerometers for structural health monitoring. Please...